
Kanban Metrics: Cycle Time, Throughput and Flow
Updated at
The Answer
Four kanban metrics do almost all the useful work: cycle time (how long an item takes from start to finish), throughput (how many items finish per week), work in progress (how many are in flight right now), and work item age (how long the thing currently sitting in your Doing column has been there). The cumulative flow diagram plots the first three together and is the one chart worth learning to read. Kanban has no velocity and no burndown chart, because both depend on a sprint boundary that kanban does not have, and the equivalent question is answered by forecasting from cycle-time history instead.
The Four Metrics That Matter
| Metric | What it measures | What it tells you |
|---|---|---|
| Cycle time | Days from starting an item to finishing it | How long work actually takes, and how predictable you are |
| Throughput | Items completed per week | Delivery rate, and the basis for forecasting |
| Work in progress | Items currently in flight | Whether you are overloaded |
| Work item age | Days the item has been in progress so far | Which card is stuck, right now |
The last one deserves more attention than it gets. Cycle time and throughput are historical, so they tell you about work already finished. Work item age is live, which makes it the only one of the four you can act on today. If a card is fourteen days old and your usual cycle time is five, that is a conversation to have this morning rather than a number to review next month.
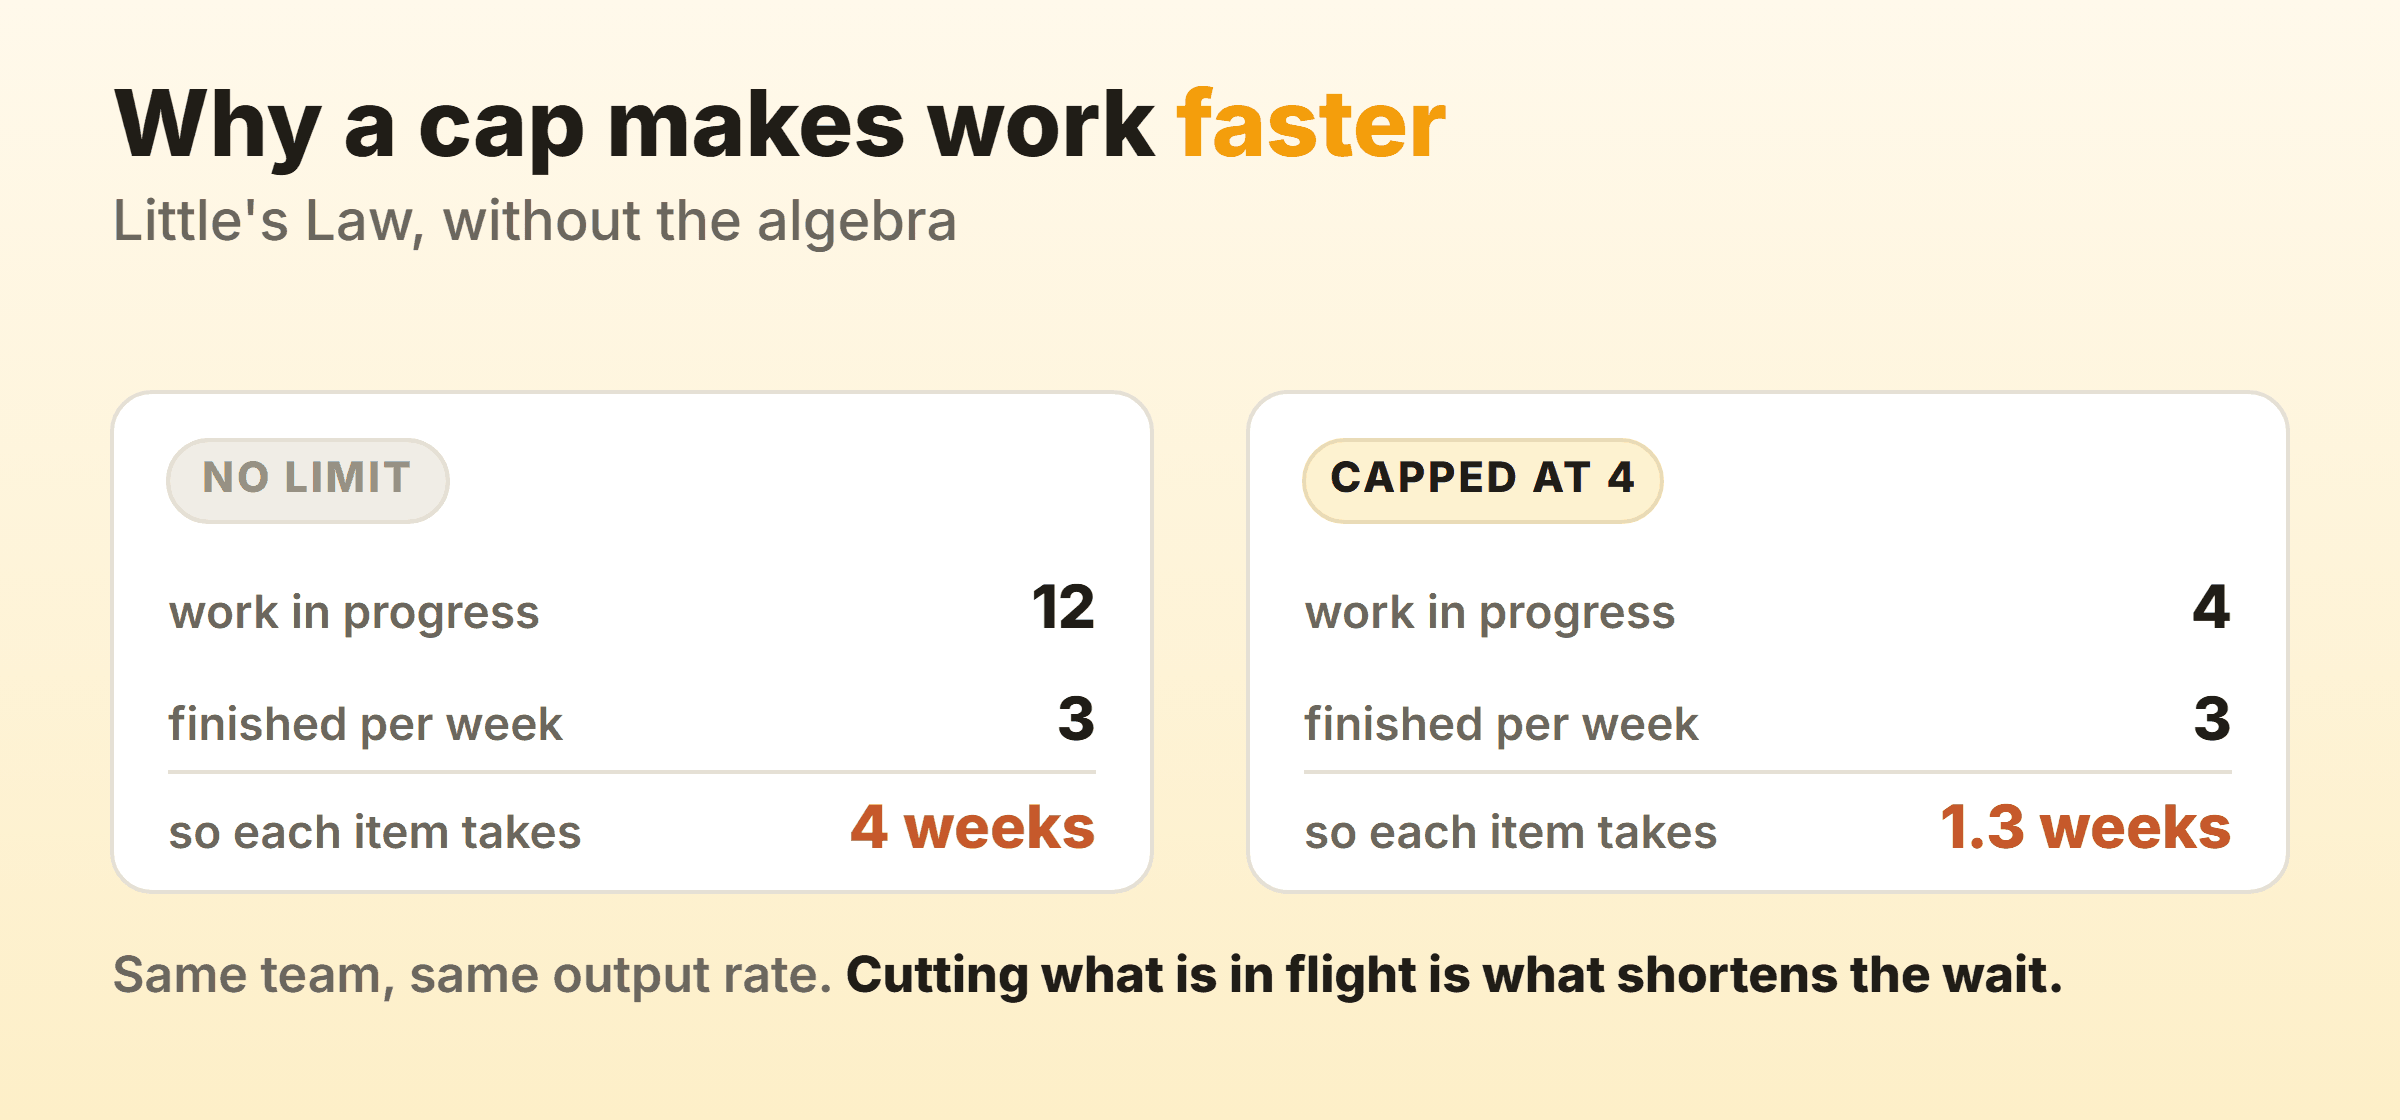
These four are related by Little’s Law, which for a stable system reduces to a useful approximation: average cycle time equals average work in progress divided by average throughput. The practical reading is that cutting WIP shortens cycle time without anyone working faster, which is the mathematical case for WIP limits.
Kanban Cycle Time and Lead Time
Kanban cycle time starts when the team begins work and ends when the item is done. Lead time starts when the customer asks and ends at the same point, so it includes however long the request sat in the queue first.
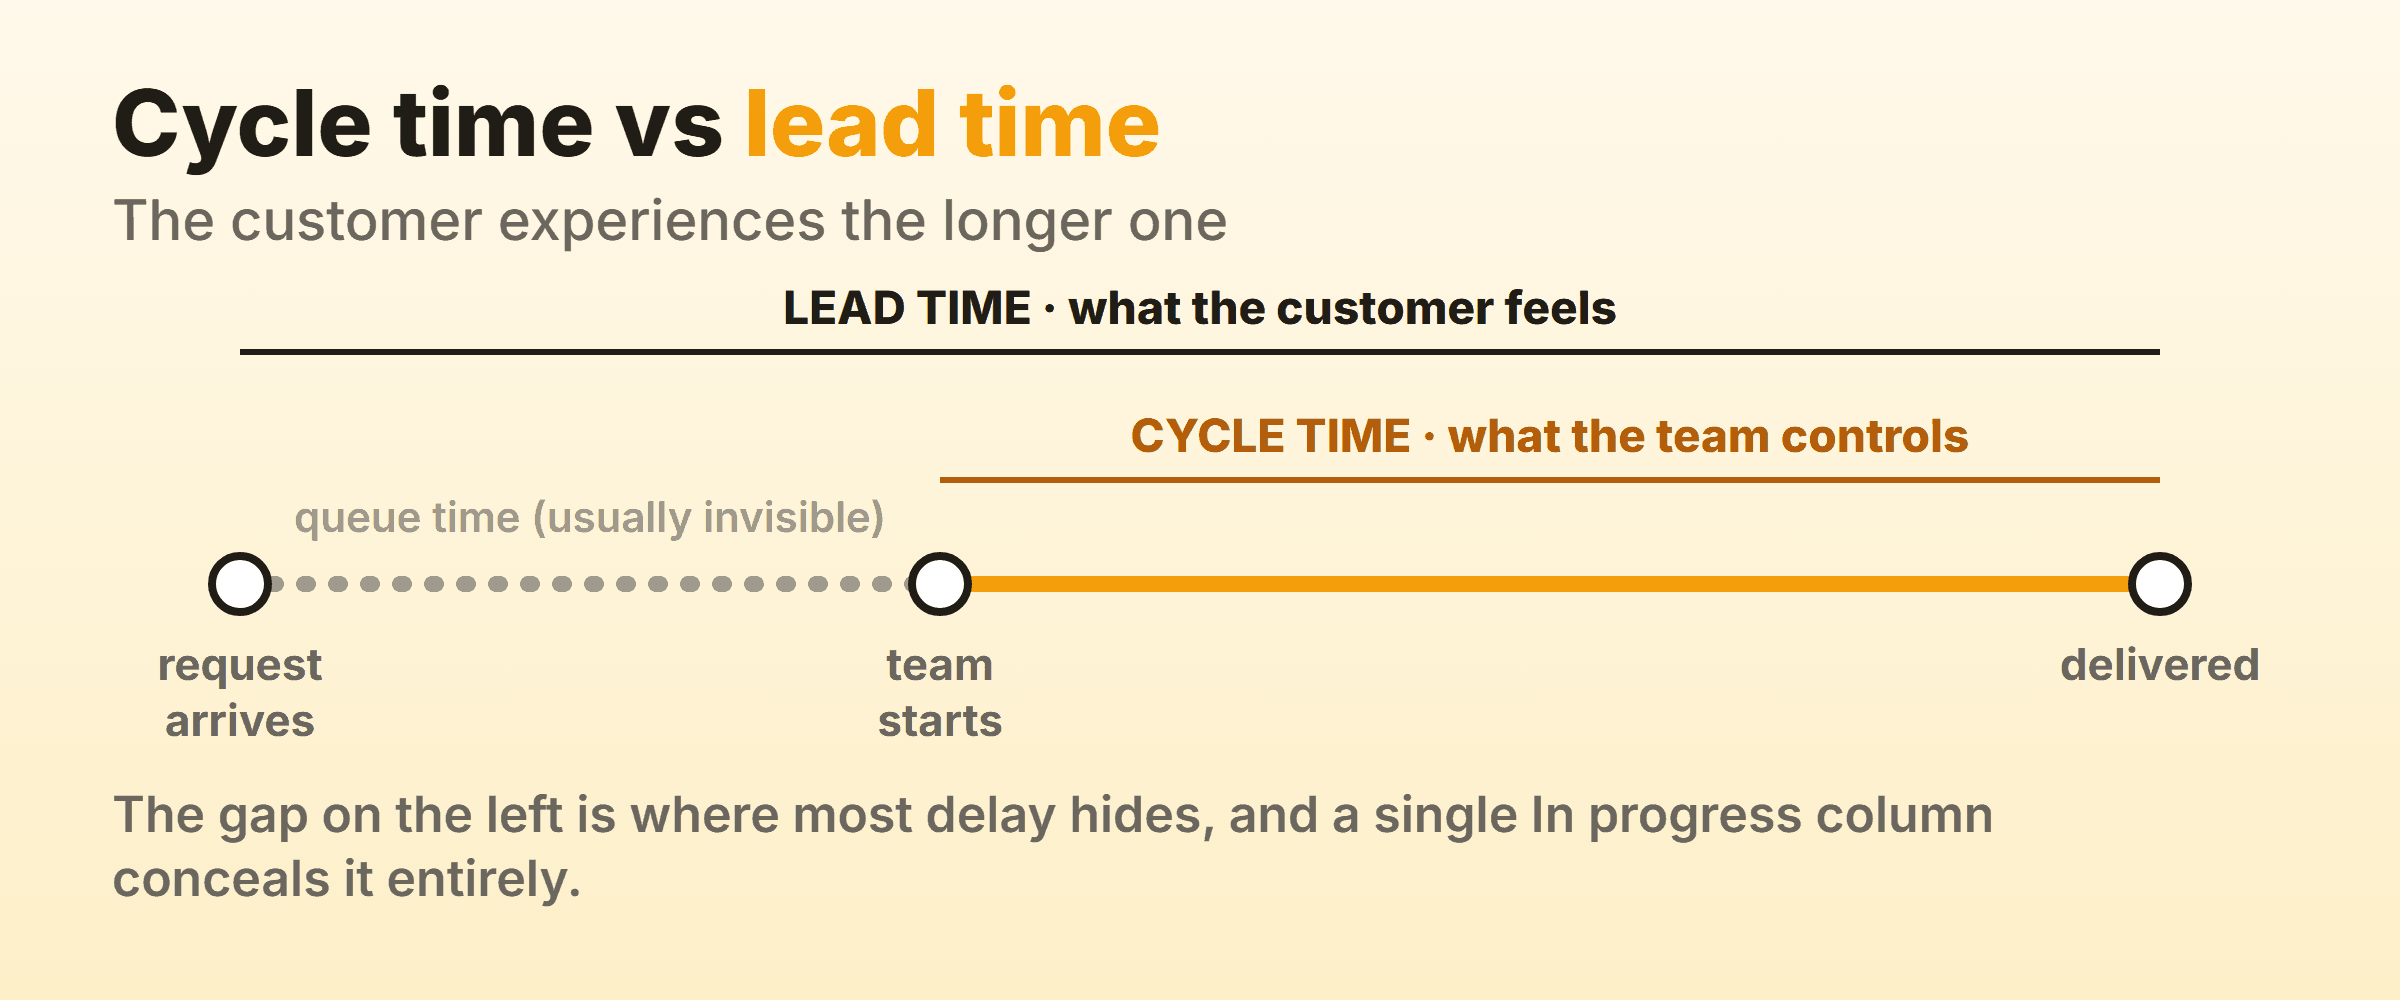
Both are worth knowing and they answer different questions. Cycle time tells you how well your process performs once work starts, and it is what the team can directly influence. Lead time tells you what the customer actually experiences, and it is usually much longer than teams expect because the queue time is invisible from the inside.
Report cycle time as a range rather than an average. “Five days on average” is close to meaningless when half your items finish in two days and the rest take a fortnight. What stakeholders can use is a percentile: if 85% of items finish inside nine days, that is a number you can plan around and defend.
Kanban Throughput
Throughput in kanban counts finished items per period, usually per week. Simple to collect, and stronger for forecasting than most teams expect, because kanban throughput sidesteps estimation entirely.
The objection is always item size. If throughput counts a two-hour fix and a two-week feature as one each, surely the number is noise? In practice, over a few weeks the variation averages out enough to be useful, and teams that split work into roughly consistent sizes get a usable number faster. If your items vary wildly, that is worth fixing for its own sake before it is worth measuring around.
Throughput and cycle time together answer the two questions stakeholders actually ask: how much can you deliver, and how long will this one take.
The Cumulative Flow Diagram
A cumulative flow diagram (CFD) stacks the number of items in each workflow state over time, producing coloured bands that grow left to right. It is the densest single view of a kanban system, and reading one is a skill worth twenty minutes.
What the shapes mean:
- Bands roughly parallel. Work enters and leaves at similar rates. This is what a healthy system looks like.
- A band widening over time. Items are entering that stage faster than they leave it. That is your bottleneck, named and dated.
- The top line climbing steeply while the bottom stays flat. You are accepting work far faster than you finish it, and total WIP is growing.
- A flat Done band. Nothing is shipping, whatever the rest of the board suggests.
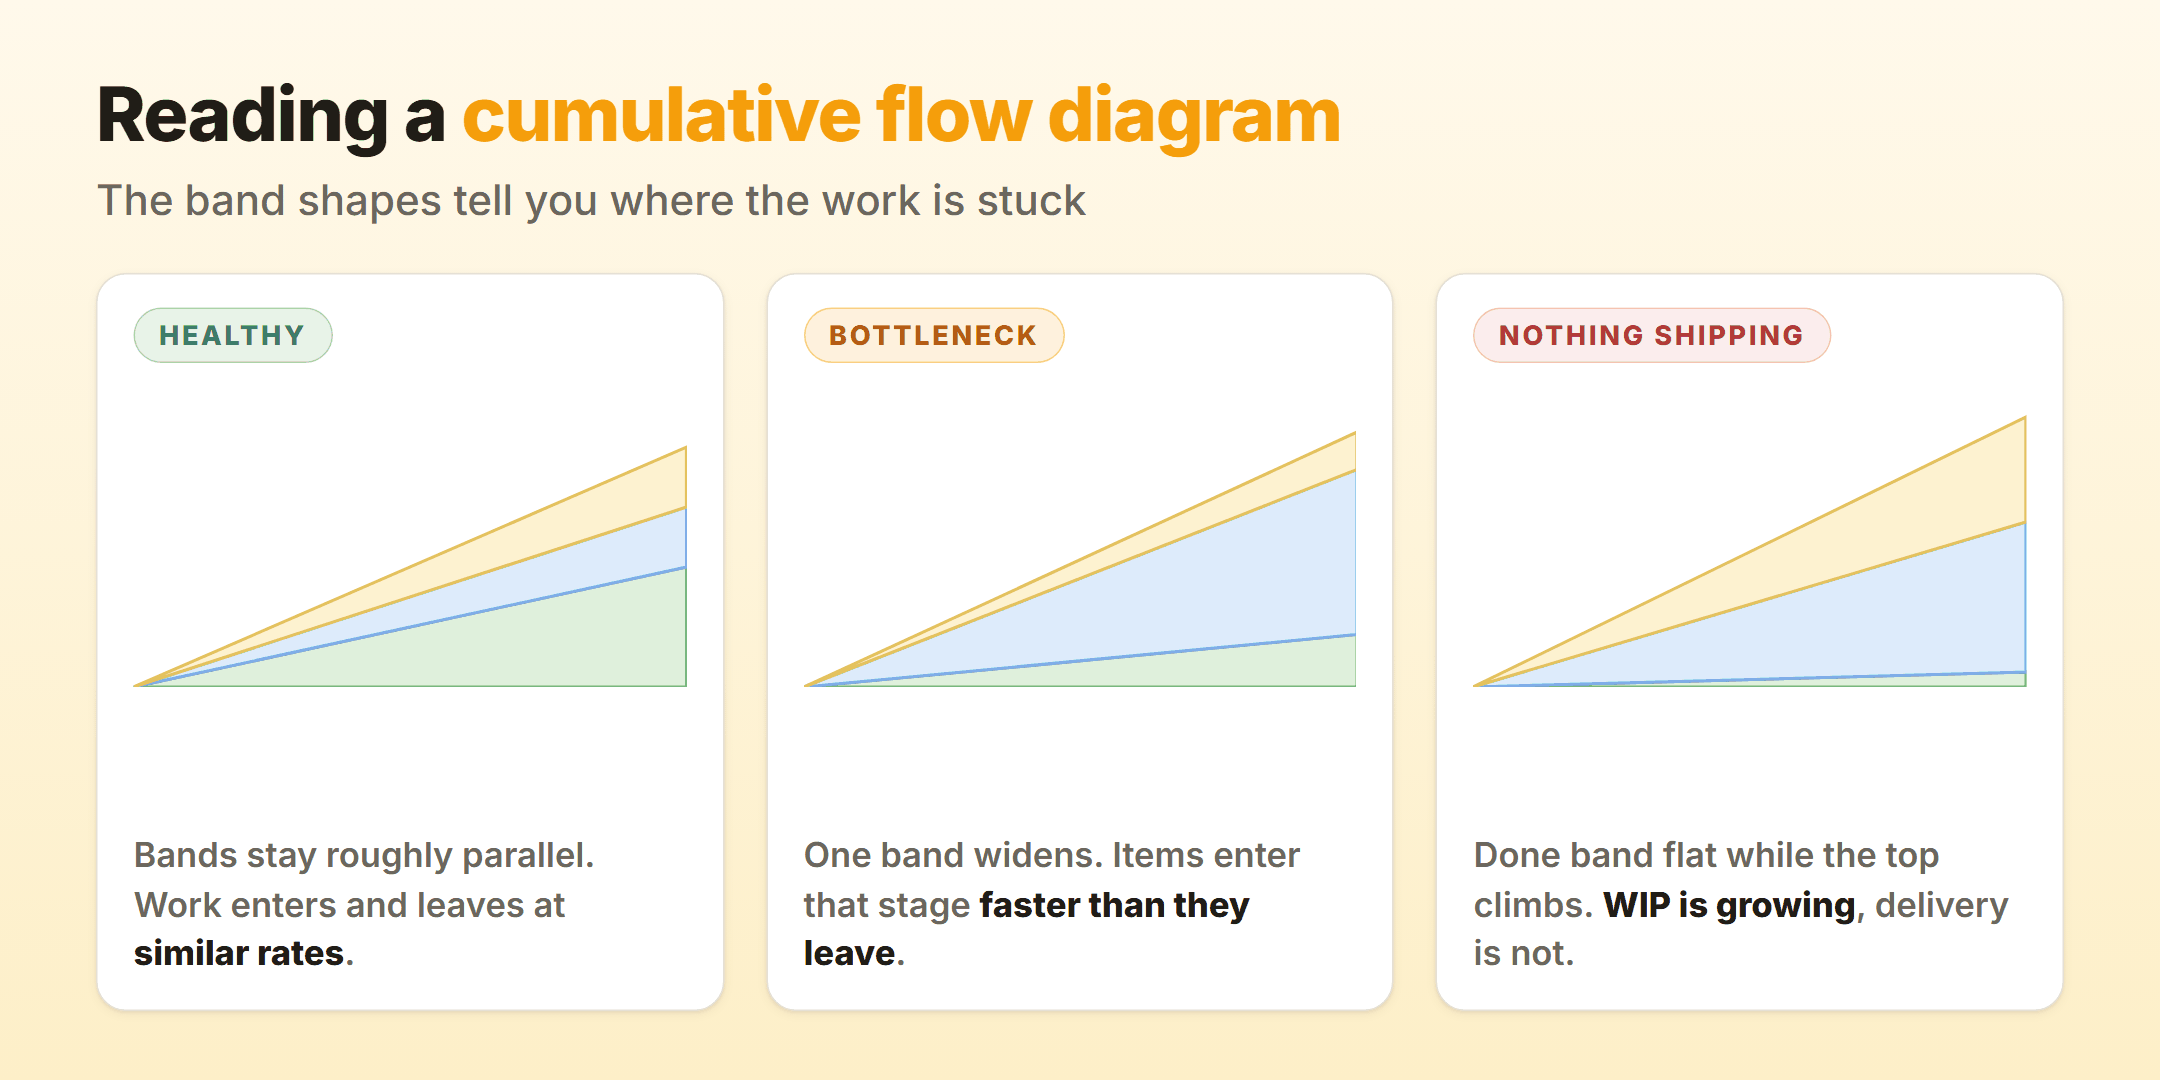
The vertical distance between the top and bottom lines at any point is your WIP. The horizontal distance between them is approximately your lead time. Once you can see both on the same chart, the argument for limiting work in progress usually stops needing to be made.
Does Kanban Have Velocity?
No. Velocity measures how many story points a team completes per sprint, and kanban has neither sprints nor a requirement to use story points, so the metric has nothing to attach to. Throughput is the closest equivalent and it counts items instead of points.
People search for kanban velocity mostly because of Jira. A Jira board will happily render a kanban velocity chart, a kanban velocity report and a velocity gadget, which creates a fair impression that the metric belongs here. What those reports measure is completion over an arbitrary period. That is throughput wearing a scrum label.
Same answer for the kanban burndown chart, and for the burnup report people ask about alongside it. A burndown tracks remaining work against the end of a sprint, so without a sprint boundary there is nothing to burn down towards. The cumulative flow diagram carries that information and a good deal more, since it shows every stage of the workflow instead of remaining scope alone.
Which Metrics to Actually Check, and How Often
Four numbers, three rhythms. This is what I run on our own board.
Daily, at the standup: work item age. Walk the board from the right and ask about anything older than your usual cycle time. Nothing else needs a daily look.
Weekly: throughput and the WIP count. Two numbers, thirty seconds. A throughput that halves while WIP climbs is the earliest reliable signal that something is wrong.
Monthly: cycle time distribution and the CFD. This is where you look for widening bands and decide what to change. Change one thing, then check next month whether it moved.
The trap worth naming is measuring everything. Kanban reporting goes wrong in a predictable way: someone builds a dashboard with eleven charts, everyone admires it for a fortnight, and nobody opens it again. Four numbers on a schedule will beat eleven kanban KPIs reviewed once.
Turning Metrics Into a Forecast
The main payoff is answering “when will this be done” without estimating. Once a board has six to eight weeks of history, you can give a date range straight from cycle-time percentiles, and it rests on what your team has actually done rather than what it hopes to do.
The honest version includes the percentile. “Items like this have finished within nine days 85% of the time” is a defensible statement. “Nine days” on its own is a promise you have not actually made. Most stakeholders take the range well once they have seen it hold, and they take it considerably better than a confident single date that slips twice. Kanban planning covers forecasting and estimation in more depth, including what to do when someone insists on story points.
Kanbanee tracks cycle time, throughput and a cumulative flow diagram per board, so the history accumulates from normal use rather than from anyone maintaining a spreadsheet.
FAQ
What is a good cycle time?
There is no universal number, since it depends entirely on your work. What matters is the trend and the spread: a cycle time that is stable and tightening is healthy, and one with a long tail means some items are getting stuck in ways worth investigating.
What is flow efficiency?
The proportion of cycle time an item spends actively worked on rather than waiting. It is often shockingly low, commonly between 15% and 40% in knowledge work, and calculating it requires splitting active columns from queue columns so the board can tell the difference.
How much data do you need before the metrics are useful?
Roughly six to eight weeks, or around twenty completed items, before forecasting is trustworthy. Work item age is useful immediately, because it needs no history at all.
Do kanban metrics work for a team of one?
Yes, and cycle time in particular. Tracking how long your own items actually take against how long you assumed they would is one of the more uncomfortable and useful things a solo worker can measure.